Embracing the grey
 For those who have spent most of their adult life married to the numbers – like me – the Broad Assessment Balance Sheet (BABS) is a mindset that takes some time to understand and accept. Completely divorcing yourself from the numbers is tough. When I make statements like, “Evan Longoria and Nick Castellanos (pictured) are the same player” – which I have been saying all across the country the past three weeks – people think I am nuts. Until someone produces a photograph of them together, I stand by my assertion.
At issue is the idea that comparable players in an asset group can be counted on to produce comparable numbers. There is an inherent fallacy to that idea. The fact is, no player can be counted on to produce his own numbers comparable to what we expect. We can’t project Longoria with enough precision for him to produce his own expected numbers, nor can we with Castellanos. There is a wide range around what we can expect from each of these two players. But BABS says, based on underlying skills, their individual ranges overlap enough for them to be pretty much the same.
Some analysts have trouble with this, saying that each range must be around a mean, and the variances between each player’s mean allows us to rank them. This is true, and would be useful if each player had a few dozen performance samples to validate the accuracy of that mean. But we get one shot – that’s it – and I’m not about to bet the rent on some blind target practice.
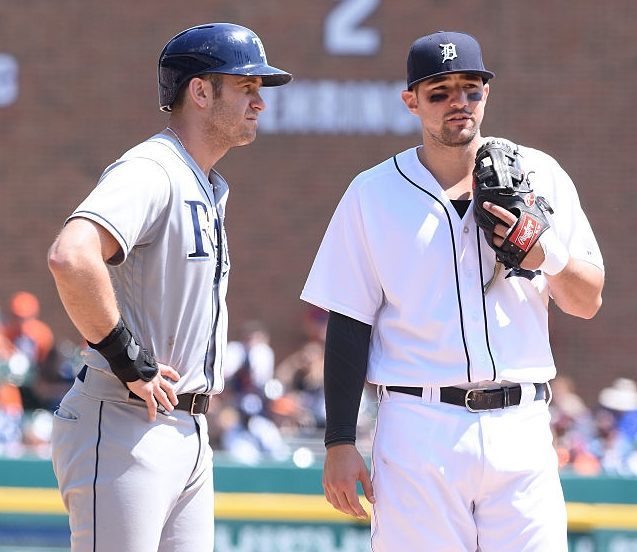 Okay, someone just sent me this. It’s an obvious split-screen fake.
When we see a list of players within an asset group, our immediate reaction is to question how they can be valued similarly. I think the best way to view each asset group is as a range of possibilities. Let’s look at the players in two nearby asset groups, view their current projections (yes, numbers) and see what we can learn.
The projections are from our good friends at BaseballHQ.com. Players are listed in order of their current ADPs.
Significant power, moderate batting effectiveness
PW,a               HR    SB    AVG
================  ====  ====  =====
Bryce Harper       30    10    .274
Evan Gattis        26     1    .255
Evan Longoria      28     2    .269
Jose Bautista      27     3    .249
Jake Lamb          26     5    .268
Jay Bruce          25     5    .257
Nick Castellanos   23     1    .267
Tommy Joseph       30     0    .256
MEAN               27     3    .262
Moderate power, moderate batting effectiveness
p,a                HR    SB    AVG
================  ====  ====  =====
Alex Bregman       23     8    .268
Anthony Rendon     16     8    .271
Salvador Perez     21     0    .257
Mike Moustakas     24     1    .269
Carlos Beltran     18     1    .267
Logan Forsythe     17     7    .257
Brandon Crawford   14     6    .263
Justin Bour        24     1    .260
MEAN               20     4    .264
These two asset groups are close to each other in the offensive rankings. But you can still see that the variances in these projected stats correspond well with BABS’ ratings. The proof is in the means. The identical (a) batting effectiveness ratings yield batting averages just a few points apart. Speed is negligible in both groups. But the difference in power rating (PW vs p) yields a more striking variance in output.
But those are the means, and means are meaningless in real life. What’s more important are the ranges.
Group     HR      SB        AVG
======  =====    ====    =========
PW,a    23-30    0-10    .249-.274
p,a     14-24     0-8    .257-.271
With identical (a) ratings, there is complete overlap between the two groups. The fact that one displays a wider spread than the other is purely random.
The identical speed groups yield stolen base totals that are too small to be projectable. If you are drafting a guy projected for 8 SBs over a comparable player projected for 2, you are missing the bigger picture here.
The home run range tells a very important story. You can see that there is a difference between the two groups, but you can also see that the groups still overlap! That is important to know. We cannot project with enough precision to guarantee that every player in the (PW) group will hit more home runs that every player in the (p) group. But the group as a whole will generate more power. That’s the best we can do.
 Complete details about the Broad Assessment Balance Sheet (BABS) can be found in the PDF eBook, “The BABS Project: Uncovering the Truth About Winning at Fantasy Baseball” for only $5. Or, get the eBook for FREE with a one-year membership to RonShandler.com, for $19.95. Here is what you get with your membership.
While these asset groups provide us with a range of possibilities, you might say that they also provide us with a range of potential. While Castellanos is being projected for 23 HRs, he’s in a group where there is 30-HR upside. While Jose Bautista is being projected for a .249 average, his presence in this asset group says that it’s not that far to .274 (a level he has achieved before). And while we see Brandon Crawford as a 14-HR hitter, his underlying skills say that 20 are within reach.
Of course, it works in reverse too, unfortunately. Tommy Joseph is being projected for 30 HRs based on his 21 bombs in 315 AB last year. But that’s no given; he might only hit 25 in 500 AB, for all we know. And Anthony Rendon may be marked down for a .271 average, but there could easily be 15 points of downward play there.
I chose just eight players from each of these two asset groups; I was looking for those with about the same number of plate appearances to create a level playing field for statistical comparison. However, these groups contain many more players. The more players you include, the higher the likelihood that there will be some outliers that extend the ranges. This is to be expected, because the BABS grades are not driven by projections. BABS is driven by the underlying skills metrics, which add a thick layer of grey over the black-or-white numbers above.
The takeaway is that we have to embrace the grey. All performances must be considered as a range of possibilities. Viewing the asset groups in such as way will help keep the numbers in perspective.
Hi Ron,
Thanks a lot for all your hard work here. I’m embracing the BABS method and started to apply it last season with good results. Just wondering, just for fun, it would be interesting to see players BABS said had similar skills before last season and look at how they performed in 2016. I’m sure there will be some exceptions but I’d bet the vast majority of the time BABS was right. That might help to convince those who still have doubts.
Once again, thank you.
I’ve posted these in the eBook and elsewhere. Lucroy and Posey were in the same asset group last year but they were being drafted 100 spots apart. BABS had no speed rating for Machado. She had Thor and Kluber ahead of Price, Greinke, Cole, etc. though they were all going in the 4th round of most drafts. Etc. etc. Etc.
I love the whole BABS concept. Embracing the leeway it gives me on drafts, knowing similar skill sets exist between perceived different players! Only question for me is at what point does consistency/past performance take a back seat to potential breakout? Longoria and Castellanos is a great example. Longo is consistent, for the most part, every year. Still waiting for Castellanos to put it ALL together. Is this a personal tolerance/preference? There is a bit of ambiguity when it comes to BABS, but I guess that’s expected now!
Hey ron I have a quick question for you. I am in an AL only 5×5 keeper league. Im trying to budget as much money towards hitting as my freezes allow me currently proj to have no more than 170 towards hitting. My “closers” are krod $19 sam dyson $6. I was offered Kintzler for $8 basically for free. Would you rather take the guaranteed saves krod provides for the extra $11 or roll the dice with kintzler and dyson at $14 and put the extra cap room towards hitting. Im leaning towards krod but was curious what you think. Thank you
also in this league just about all closers are frozen except for those coming over like chapman way too expensive
Hi Ron—
I have a question about BABS’s sample sizes: does she have an optimal size? On the one hand, the sample of Trea Turner’s performance is slender, I get that. But what about someone such as, say, Granderson or even Bautista—long-time veterans whose sample size, if taken over the whole career, might be disguising recent developments in the assets profile. Or does risk (aging, etc.) account for this?
Brad
Shades of grey. It *is* personal preference. And, FWIW, Castellanos already put it together LAST year. He just got hurt.
I count a half dozen bullpens in the AL where the presumed closer today is maybe a 50-50 bet to keep the job all year. MIN and TEX are two of those six. General advice is never to protect more than one closer on a keeper list, but you have to know your league. If it was me, I’d spend $19 for KRod and then fish.
Sufficient sample size is taken into account with the Experience liability. Once a player passes that bar, he’s just as projectable and stable as any other veteran (which is NOT MUCH, but we all know that).
Hi Ron, Love BABS concept. In the spirit of embracing the grey, and moving away from the specific numbers, might I also assume that the traditional budget splits between pitching and batting should also be re-analyzed? E.g. If you can hit your targets most effectively and spend say 55/45 Hitting to Pitching instead of a more traditional 65/35 split, I would assume that BABS would say go for it? Is there a point where this doesn’t make sense?
Thanks,
Ryan
Budget splits? We don need no stinkin’ budget splits…
Great content, as always. How would BABS apply to head-to-head category leagues? Would there be modifications, or conceptually would things remain mostly the same?
Read Chapter 12 in the eBook: BABS in Leagues with Alternative Rules
Regarding the problem with the mean… “On average, human beings have one testicle.”
I was pretty on board with BABS after reading the e-book, and am pretty on board with what I saw on the spreadsheet, but am really struggling with how peraza, with pretty minimal experience, ends up in the $35 bracket, and Altuve, who has earned pretty high, 30+ consistent returns 3 years running, is valued in the $15 bracket. Doesn’t pass the sniff test.
The Experience Liability is what widens Peraza’s error bar and reduces his market price. His spot in the $35 tier indicate potential upside, and profit for you, but the tier itself is meaningless because he’ll never go for that price. Admittedly, BABS is not fond of Altuve’;s underlying skill set. He’ll never go for $15 either, but it’s a warning that whatever you pay will likely be too much. Don’t put too much value on the tiers themselves; they are more about separating the players than attaching a value.