FREE REPORT
Click here to download the PDF version of this report.
The question is simple enough:
Name the player who belongs to this 2019 projection:
 AB     R    HR   RBI   SB    AVG
550    85    25    75    5   .260
At first glance – and without cheating and looking it up – this seems like it could be the stat line posted in 2018 by Rafael Devers. Or perhaps it is where Ozzie Albies ended up after his hot start. Or was it Matt Chapman, or maybe Stephen Piscotty? How about Asdrubal Cabrera or Jed Lowrie?
YOU: Okay, I’ll play. Probably not Albies. It could be any of the rest of them.
That’s the point. It is a pretty common, middle-of-the-road stat line. In fact, looking ahead to 2019, there are no fewer than 49 players who could reasonably put up these numbers.
49?? That seems like a lot. I’d think maybe a dozen or so, but 49?
I scanned the projections at several websites and found 49 players who could fit that statistical description with hardly a second thought. However, those 49 players are spread deep throughout the current Average Draft Position (ADP) rankings. One player is being drafted as high as Round 3. Another is as low as Round 32! And both are reasonable bets to finish the upcoming season at 550-85-25-75-5-.260.
Those two have to be outliers. The rest should be ranked pretty close.
Here is the distribution of the 49 players within the ADPs:
ADP range     Pct
1-100         20%
101-200       41%
201-300       24%
301-400       10%
Over 400      4%
It seems crazy that those stats can be rostered at so many different points during the draft. But there is a “sweet spot” here. Ten of those 49 players (20 percent) have ADPs between 100 and 129. In a 15-team league, that’s the middle of round 7 to the middle of round 9. These players include names like Josh Donaldson, Max Muncy and Rougned Odor. All have the potential to post 550-85-25-75-5-.260.
I suppose that is about where I’d expect to get those stats.
That’s right! So why are we drafting those same stats as much as four rounds earlier? And how can we still find players with those stats over 20 rounds later? You call them “outliers.” Let’s see.
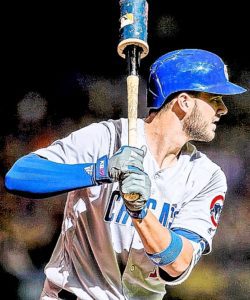
The highest-ranked player who could reasonably post the 550-85-25-75-5-.260 stat line is… Kris Bryant, currently an early 3rd rounder.
Oh, come on. He’s much better than those numbers. Remember 2016?
 Yes, we expect much more from Bryant, but his injury-shortened 2018 season was actually on that relative pace (actually, his pace was only 18 HR). A healthy Bryant could potentially put up 30+ HRs, a .290s batting average and big counting stats like 2016. But that’s three years ago now so a conservative expectation might be more prudent. Some friends in the prognosticating business agree:
               AB     R     HR    RBI     SB     Avg
Steamer       552    99     29     88      7    .275
Baseball HQ   511    88     24     73      5    .281
Rotowire      580   104     27     81      4    .283
All these projections are within striking distance of our starting point, or have variances solely dependent on his surrounding team performance. The only real difference is about 20 points of batting average, which, over a full season, is about two hits per month. That is well within the range of normal statistical variance.
I’m still buying.
In the 3rd round?
If that’s his price. He had a 1st round ADP just last year! This is still a discount.
Yes, those memories of him being a 1st rounder are still anchoring him as a high pick, even as a 3rd rounder. The marketplace is still clinging to 2016, but if the sweet spot for that stat line is Round 7-9, they are paying for an upside that is not guaranteed. Perhaps that upside is a fair assessment long term, but for 2019? You don’t want to be paying for “hope.” The 550-85-25-75-5-.260 line still seems like a reasonable possibility.
Are you saying I should ignore the upside?
I am saying you should pay for the stats you are likely to get at the lowest point in the draft where you can get them. Of course, if the marketplace says BRYANT: ROUND 3, that’s where you have to jump in or you’ll lose him. But so what?
There are 48 other players who are being drafted lower, all of whom have roughly the same potential for 550-85-25-75-5-.260. If you can get those numbers with a later pick, why overpay? You could get similar numbers from guys like Cody Bellinger, Carlos Correa, Mitch Haniger and Eddie Rosario. They all have a history or trend that could reasonably support a stat line like that, and later in the draft.
Correa is better. Bellinger should bounce back. Also, some of these guys steal far more than 5 bases. That has value these days.
Yes, you can make that argument, but in today’s changing game, you never know who is going to get the green light any more, and how bright that light will be. For instance, Thomas Pham and Wil Myers, two players projected for 15-20 SBs, are facing declining output and are coming off of a season with foot injuries. Could they only steal five? Maybe, maybe not, but we might be quibbling over only a handful of bags in the end. Both are on the 550-85-25-75-5-.260 list.
What about the outliers at the bottom of the draft pool? Are you telling me that someone I draft in the reserve rounds could still put up that stat line?
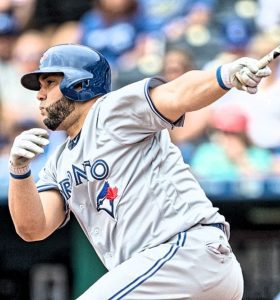
Yes, that’s right. The 550-85-25-75-5-.260 player currently going in Round 32 is… Kendrys Morales.
Isn’t Morales ancient? Isn’t he blocked for playing time?
Morales hit 21 HRs and batted .249 in 413 AB last year, but slammed 28 and 30 HRs in the two seasons prior. As of early February, there doesn’t appear to be anyone seriously challenging him for playing time at DH in Toronto, so it is within a reasonable range of outcomes that he could return to the 500-plus AB level.
Oh, and he is 36, the same age as Robinson Cano and Edwin Encarnacion. Are you writing them off yet?
Hmm, no.
Similarly, Mitch Moreland, currently going in the 30th round, has a history of power in the 20s. Yes, he only hit 15 in 2018 and will battle Steve Pearce for playing time, but Pearce has averaged 40 days on the disabled list each of the past four years (50 days in 2018). Maybe it’s a safe bet that Moreland falls short of 550 AB; even still, the rest of the stat line could go nearly chalk.
So there are boring players with deep ADPs who could post those numbers. I’m not interested.
They may be boring, but you’re not drafting players based on excitement. They add the same numbers to your bottom line as the earlier drafted players. Other 550-85-25-75-5-.260 names outside the top 300 include Jay Bruce, Asdrubal Cabrera, Joc Pederson and Ryon Healy.
So let me understand this. Are you saying that it’s better to draft Joc Pederson in Round 21 than to draft Eddie Rosario in Round 6?
Not necessarily better, but certainly more equal than their respective ADPs would lead you to believe. Mining the gaps between the projections and draft behavior is the secret to a fantasy baseball title. It’s all about profit.
These gaps are usually due to uncertain playing time, which can be a result of injury concerns or roster crunches. At minimum, you should be asking yourself, why pay an early round price when you could get almost the same stats later in the draft? The answer is, you shouldn’t, as long as you take any risks into account when planning out your roster. I’ll talk more about risk in a minute.
All right. But are you going to tell me who the 49 players are?
Sure: Bellinger, Belt, Braun, Bruce, Bryant, A.Cabrera, Carpenter, Cespedes, Chapman, Correa, Cron, DeJong, Devers, Donaldson, Dozier, M.Franco, Av.Garcia, Grandal, Grichuk, Haniger, Healy, Hicks, Hosmer, Kepler, Mancini, Mazara, McCutchen, Morales, Moreland, Muncy, W.Myers, Odor, Ohtani, Pederson, S.Perez, Pham, Piscotty, Pollock, Puig, Realmuto, F.Reyes, E.Rosario, C.Santana, Schebler, Schoop, K.Seager, Smoak, Springer and Voit.
Come on – Cespedes?
Okay, that might be a bit of a stretch given his injury, but 550-85-25-75-5-.260 is still a legitimate line for him if he got the playing time. I’ll give you that one. There are still 48 others. You have gripes with any of them?
Probably not. But 550-85-25-75-5-.260 is just one stat line. I assume there are similar bargains with other groups of players.
There are dozens of different stat lines that describe groups of players. Some are large groups like this, most others are somewhat smaller. Nearly all present potential profit opportunities. However, we can’t take those stats and infer that they measure anything precise. They are not always an accurate representation of skills.
What do you mean?
As shown above, there is a ton of variability in the statistics. One player can hit 25 HR with a .260 average and another hit 30 HR -.285, and both could own the exact same underlying skills. Yet those two lines could be drafted several rounds apart.
Similarly, those two stat lines could represent two different years for the same player. So we need to find a way to describe that player’s underlying skill – which can generate very different stat lines – so we can rank him more accurately.
So, how do we do that? Is there a way to measure and rank underlying skills?
Glad you asked. The Broad Assessment Balance Sheet (BABS) is a model that groups players with similar skills and then ranks them by ADP (and average auction value — AAV). But, rather than using a stat line like 550-85-25-75-5-.260, BABS groups players into categories of skill types – batting power, speed, pitching dominance and the like.
BABS rates players as having poor, moderate, significant or extreme skill in these categories, and all based on the latest advanced metrics. Then BABS mixes and matches players with like profiles and ranks them by ADP.
For instance, this was a group of players from the 2018 draft list, all of whom were rated as having extreme power and significant batting average:
ADP    Player            Pw      Sp      Av
---    -------------    ----    ----    ---
8      Stanton,G         P+              AV
21     Freeman,F         P+              AV
24     Martinez,JD       P+              AV
All three players have essentially the same skills profile (P+,AV). Normal statistical volatility might vary their respective numbers, but they should perform within a reasonably close range. The ADPs tell us that you could have drafted that skill set at ADP No. 8, or you could have grabbed essentially the same skills 16 picks later.
This seems way too simplistic.
That’s actually the beauty of it. Since the ratings are still based in sound analytics, they account for the wide ranges of possible outcomes. But BABS goes a step further, adding risk indicators for every player. In this way, you can evaluate those within the same skills group and make your draft choices based not only on ADP/AAV but on variables like health, experience and park factors as well.
Here is another example from the 2018 draft list:
                                       ASSETS           LIABILITIES
ADP   AAV   Player           PT       Pw / Sp / Av     Inj / EX  / Misc
---   ---   ------------    ----     --------------    ----------------
49    $20   Hoskins,R         F       P+        a            EX
183    $7   Carpenter,M       F       P+        a
196    $6   Conforto,M        M       P+        a      INJ    e
These three players all were rated as having extreme power and moderate batting average. Here, you could have drafted Rhys Hoskins in the 4th round (or pay $20 for him), even with the risk posed by his lack of Major League EXperience. However, you could have opted for the same essential skills profile nine rounds later ($13 cheaper) with Matt Carpenter, who was less risky. Or, if you missed out on Carpenter, there was still Michael Conforto – same skills profile, but projected for less playing time, and with injury and experience risk.
And you would have ended up with:
                AB     HR      BA
Hoskins,R      558     34    .246
Carpenter,M    564     36    .257
Conforto,M     543     28    .243
That’s how BABS works.
Wait a minute. Conforto hit way fewer homers than the other two! Your BABS system doesn’t work!
Oh, it worked just fine. Conforto’s pre-season rating warned us of his injury risk and that is exactly why his power numbers were off. He hit only 10 HR in the first half but 18 in the second half.
Hmmmm. Okay. I’m starting to understand. Is there anything more you can show me?
Sure! Here is a recent article that analyzes this year’s meager catcher pool. It will give you an idea of how BABS can shape your draft behavior.
Thanks, I’ll check it out. So how can I use BABS to draft this year?
BABS ratings and cheat sheets for 2019 are available right now. You can get those, plus a ton more, with a one-year membership to RonShandler.com that includes all this:
- The BABS Project: Uncovering the Truth About Winning at Fantasy Baseball. This PDF eBook is the core of the Broad Assessment Balance Sheet. It may change your way of thinking but these people seem to think it’s worth it.
- BABS ratings, group rankings and cheat sheets for 2019 drafts: The foundation of your draft
 efforts, updated regularly through the end of March.
 - Custom reports from the BABS Database: If you are in an AL/NL-only league, or need lists sorted alphabetically, by ADP or position, the database can do it. Updated all season long.
- Ongoing analysis: This time of year, you’ll get 2-3 articles per week from Ron and his writers, digging even deeper into BABSian philosophy and player analysis.
- Members-only message boards: A growing community of fantasy leaguers, analysts and BABSofiles. Ask questions, offer insights, vent – it’s your neighborhood.
- BABS ratings for RotoLab software: The best draft software on the market has a BABS module, complete with all the Asset and Liability ratings. Once you try it, you’ll never go back. (Software sold separately.)
- BABS minor league ratings: To provide additional insight into the deeper ends of the player pool, BABS rates nearly every Double-A and Triple-A player from 2018.
- BABS Baseball leagues: There is a new fantasy format that incorporates the best parts of BABS while keeping a pulse on the changing baseball environment. The template is already set up for you and leagues are forming right now.
- Commentary, polls, contests and more: More ways to keep you involved!
All of the above, plus few special surprises are just $19.95 for a one-year membership. Your membership begins when you sign up and extends a full year from that date, so you’ll really be covered for parts of two draft seasons!
Yeah, I’m not sure I want to spend that. Is there a way I can check you out without committing yet?
Sure, okay. You can sign up for our free “Ron’s Hits & Errors” email which is sent every Friday. It includes links to the latest content on the site, along with notes and insights from Ron Shandler himself. You can unsubscribe at any time. Just enter your email address below.
[wysija_form id=”5″]
However, if you’re ready to take the leap and embrace the full competitive intelligence that BABS offers, you can sign up to become a member right now. Join us, and stake your claim to a 2019 championship!
NOTES: User Name below must not contain any spaces and cannot be your email address. Once you complete the below, you will be taken to the secure site at PayPal.com for processing.
[register_form]

