Positional Market Analysis
Positional Market Analysis shifts the focus to a by-position look at the marketplace. These are essentially BABS-infused positional depth charts.
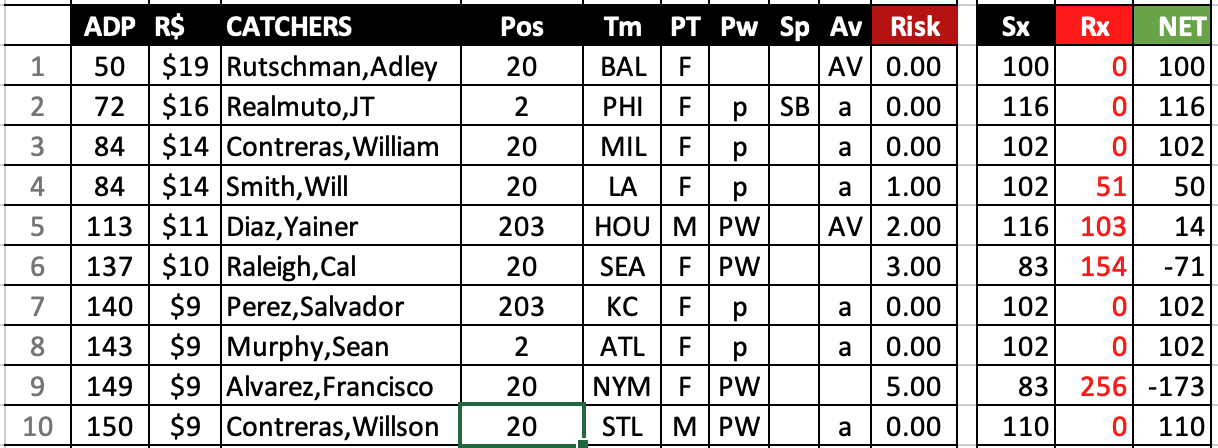
How to read this report: Players are sorted according to their ADP ranking. This is a market-driven approach, which is different from our normal reporting that sorts players by Asset Group. Players should go off the board in more-or-less this order, but when it's your time to draft, you'll be able to see players further down the list who might be better picks. The deeper you get, look for a positive skills index (over 100) and a net positive as compared to risk (Net > 0).
Skills Index and Risk Index: At the far right are these two new metrics added to our analytical arsenal. For each, we set a baseline from the average of the top 350 players in each update and scale everyone else from 100. This provides a quick glance at which players offer the best skills/risk balance. Any player with a positive net is a safe player to draft. In the above example, there is a run of catchers between picks 137 and 150, which indicates that the market views them somewhat comparably. The Px/Rx table shows that the best pick among this quintet might actually be Willson Contreras at 150.
Each position section also includes a separate Rx/Sx table that creates 5-player tiers so you can tell where it is safest to fish. Here is a sample, from the top of the catching pool:
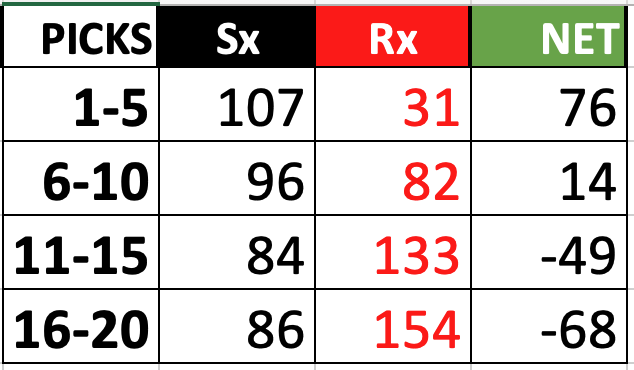
Again, this will help you find pockets of talent and risk that others may be overlooking.