2020 Player Pool Overview
When in the midst of draft prep, it can be helpful to take a birds-eye view. Remove the names and it can provide a different, possibly refreshing perspective. Welcome to the second annual exercise in which we take a high-level accounting of the BABS player pool.
Batters
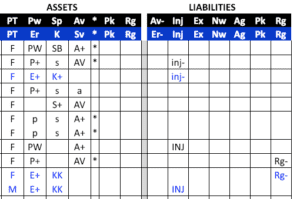
As discussed last year around this time, a 15-team setup requires 14 starting bats per squad (210 total). This season, BABS has 174 full-time batters in her database. Keep in mind that only seven catchers are projected to see 500 plate appearances. Subtract the catcher position altogether and the minimum number of starting offensive players is 180.
Of the 178 full-timers, 14 (8%) are BABSian triple threats — players with positive assets in all three of power, speed and batting effectiveness. Most of these players will be gone before the second round is over. Those that remain present possible profit centers.
Speed is coveted, which goes a long way toward explaining the premium value of triple threats. In total, 48 full-timers (28%) come equipped with a speed asset. Going deeper, 10 of the 48 are single asset one-trick ponies. Which leaves, after the triple-threats and one-tricksters, 24 dual asset speedsters. Just six are power/speed combos. The double tap of batting eff./speed counts 18 members.
Power assets again appear in just over half of the full-time pool of players. This year, 98 players (56%) are projected for a moderate or greater impact in the power department. There were 100 such players in 2019 (56%). There are 47 power/batting blends, and 30 batters hold a singular power asset. The power group is made up of 11 extreme (P+), 38 significant (PW) and 48 moderate (p) assets.
Of the 115 projected batting effectiveness assets, 35 are BA only. There are a grand total of 75 position players projected for 500+ plate appearances who possess one lone asset. Another 13 are completely sans assets. So 88 out of 174 full-time batters contain one or fewer assets. That leaves 86 multi-asset players in total (49%).
Additionally, there are 19 power liabilities (-P), nine BA liabilities (-A) and 71 injury liabilities.
Batting proficiency gets thinner as the plate appearance projections get smaller. There are 88 mid-time batters in the BABS database. We have three triple threats, eight power/BA, six power/speed and three speed/BA combinations. The extreme skill count is only four (1 P+, 2 S+, 1 A+). Power assets are 36 in all (1 P+, 12 PW, 23 p). Speed has 16 altogether (2 S+, 4 SB, 10 s). Batting effectiveness is included in 32 player projections (1 A+, 9 AV, 22 a).
Pitchers
Rostering pitchers in fantasy baseball is often an exercise in forced flexibility fueled by fluidity. Arms fall to injury all the time, so we must adjust.
To be sure, we don’t have to fill nine pitching slots with just starting pitchers, but the numbers are daunting nonetheless. In a 15 team setup, there are a total of 135 pitching slots. The BABS database currently has 37 starting pitchers projected for 180+ (F) innings pitched. However, there are 92 mid-timers (120-179 IP).
Of the 37 full-timers, 28 count strikeouts as an asset (4 K+, 13 KK, 11 k). And 21 out of 28 possess Er assets to match. There is a good chance your roster includes only one or, at best, two, from this subset. There are still four others who hold single Er assets.
The liability percentages are low within the full-time crowd. There are eight injury, four Er and three K liabilities.
After that, it’s into the mid-time pool. It’s crowded, but there are still areas of supreme skill. We have no choice but to assume the risk.
Of 92 mid-time starting pitchers, merely 19 contain an Er asset. The good news: 18 of 19 also have the desired strikeout asset to complement it. That’s the shallow end of the pool.
Wading deeper, we see 20 other K assets. These come without the Er complement, and eight of the 20 exacerbate it further by owning -E liabilities.
It’s starting to feel like we are drowning in risk, and it’s mostly true. The mid-time contingent is rife with it. There are 23 Er liabilities (-E), three strikeout liabilities (-K) and 22! Er/K combo liabilities (-EK). Not to be outdone, injury risk is present in 39 out of 92 mid-time SP. Finally, there are 36 injury liabilities in the set.

